The first major version of the FastAI deep learning library, FastAI v1, was recently released. For those unfamiliar with the FastAI library, it's built on top of Pytorch and aims to provide a consistent API for the major deep learning application areas: vision, text and tabular data. The library also focuses on making state of the art deep learning techniques available seamlessly to its users.
This post will cover getting started with FastAI v1 at the hand of tabular data. It is aimed at people that are at least somewhat familiar with deep learning, but not necessarily with using the FastAI v1 library. For more technical details on the deep learning techniques used, I recommend this post by Rachel of FastAI.
For a guide on installing FastAI v1 on your own machine, or cloud environments you may use, see this post.
Training a model on Tabular Data
Tabular data (referred to as structured data in the library before v1) refers to data that typically occurs in rows and columns, such as SQL tables and CSV files. Tabular data is extremely common in the industry, and is the most common type of data used in Kaggle competitions, but is somewhat neglected in other deep learning libraries. FastAI in turn provides first class API support for tabular data, as shown below.
In the example below we attempt to predict mortality using CDC Mortality data from Kaggle. The complete notebook which includes data pre-processing of the data is available here: https://github.com/avanwyk/fastai-projects/blob/master/cdc-mortality-tabular-prediction/cdc-mortality.ipynb.
Data loading
The FastAI v1 tabular data API revolves around three types of variables in the dataset: categorical variables, continuous variables and the dependent variable.
dep_var = 'age'
categorical_names = ['education', 'sex', 'marital_status']
Any variable that is not specified as a categorical variable, will be assumed to be a continuous variable.
For Tabular data, FastAI provides a special TabularDataset. The simplest way to construct a TabularDataset is using the tabular_data_from_df helper. The helper also supports specifying a number of transforms that is applied to the dataframe before building the dataset.
tfms = [FillMissing, Categorify]

tabular_data = tabular_data_from_df('output', train_df, valid_df, dep_var, tfms=tfms, cat_names=categorical_names)
The FillMissing transform will fill in missing values for continuous variables but not the categorical or dependent variables. By default is uses the median, but this can be changed to use either a constant value or the most common value.
The Categorify transform will change the variables in the dataframe to Pandas category variables for you.
The transforms are applied to the dataframe before being passed to the dataset object.
The TabularDataset then does some more pre-processing for you. It automatically converts category variables (which might be text) to sequential, numeric IDs starting at 1 (0 is reserved for NaN values). Further, it automatically normalizes the continuous variables using standardization. You can also pass in statistics for each variable to overwrite the mean and standard deviation used for the normalization, otherwise they will automatically be calculated from the training set.
Learner and model
With the data ready to be used by a deep learning algorithm, we can create a Learner:
learn = get_tabular_learner(tabular_data,
                            layers=[100,50,1],
                            emb_szs={'education': 6,
                                     'sex': 5,
                                     'marital_status': 8})
learn.loss_fn = F.mse_loss
We use a helper function get_tabular_learner to setup the tabular data learner for us. We also have to specify an MSE loss function since we are performing a regression task.
A FastAI Learner combines a model with data, a loss function and an optimizer. It also does some other work like encapsulate the metric recorder and has API for saving and loading the model.
In our case, the helper function will build a TabularModel. The model will consist of an Embedding Layer for each categorical variable (with optional sizes specified), with each layer having its own Dropout and Batchnormalization. Those results are concatenated with the continuous input variables which is then followed by Linear and ReLU layers of the specified sizes. Batchnormalization is added between each layer pair and the last layer pair only includes the Linear layer.
By default, an Adam optimizer will be used.
You can print a summary of the model using:
learn.model
Learning rate
Before we can start training the model, we have to choose a learning rate (LR). This is where one of the FastAI library's more useful and powerful tools come in. The FastAI library has first class support for a technique to find an appropriate learning rate with lr_find.
learn.lr_find()
learn.recorder.plot()
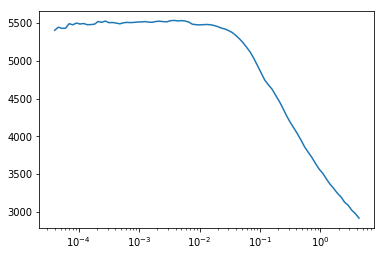
Doing the above will (after some training), produce a graph such as this:

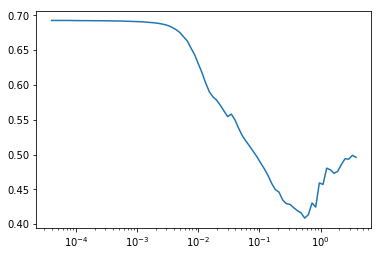
Another example:

An appropriate LR can then be selected by choosing a value that is an order of magnitude lower than the minimum. This learning rate will still be aggressive enough to ensure quick training, but is reasonably safe from exploding. For more details on the technique, see here and here.
Training
We are now ready to train the model:
lr = 1e-1
learn.fit_one_cycle(1, lr)
The fit_one_cycle call fits the model for the specified number of epochs using the OneCycleScheduler callback. The callback automatically applies a two phase learning rate schedule, first increasing the learning rate to lr_max (which is the learning rate we specify) and then annealing to 0 in the second phase.
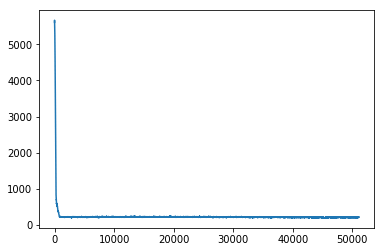
Loss and metrics are recorded by the Recorder callback and are accessible through learn.recorder. For example, to plot the training loss you can use:
learn.recorder.plot_losses()

Initial thoughts on FastAI v1
The FastAI v1 experience has so far been really great. The pre-v1 releases were usable, but definitely lacked some polish (particularly the documentation). The new documentation site is great, and thoroughly explains a lot of the API.
The API itself is incredibly terse and you can do a lot with very few lines of code. I look forward to diving deeper into the API and exploring its flexibility. Another great thing about the API is the consistent use of Python Type Hints which makes it much easier to deduce what the API expects or does while working in notebook environments, in addition to catching obvious errors.
References
The documentation that was released with FastAI v1 is really great, you can check it out here: http://docs.fast.ai/
Then I also have to mention the really great FastAI forums, its very possibly the best deep learning forums in existence.
Lastly, if you haven't done so already, the FastAI course is strongly recommended. A new version of the course based on v1 of the library will launch in early 2019.

